
Create infographics with Photoshop: design, SEO and viral posts – free explanatory videos (German)
Designing infographics yourself with Photoshop is not that difficult! As long as you take a little time, get to know some tools and learn how to work with layers and groups. With this knowledge you can create great infographics within minutes. For your blog, for Instagram, Facebook, Pinterest or even for your news section in your online shop, e.g. for search engine optimization. In this video you learn step by step how to create great graphics on your own. The big advantage is that you can save these templates and use them again later for further infographics, of course also for your employees! So you will save a lot of time in the future, get new Photoshop skills, have a uniform design and can quickly add new themes. Have fun learning with my new Infographics Special! In this article you will find all 3 sample videos. Creating infographics with Photoshop, from design to SEO and viral posts. If you liked my free explanation videos, follow my Photoshop Playlist or me on Youtube: Lukinski!
Create an infographic (1): Step by step
The first step: Consider which content brings the most added value for your visitors. For example, if you run an online shop for pet food, make a graphic about “The 5 sweetest dogs”, “The 5 most popular pets” or “The 3 most popular birds for home”. This way you can create great content that your readers will appreciate, as well as the algorithm of search engines, but also social networks, because infographics are very popular among users. Tip: Include your logo and domain in the URL so everyone knows who made the graphic. This way you get additional reach, even if others share your infographics.
Example: Fruit and healthy food
In today’s example, we are looking at an infographic for our fashion magazine, more specifically, it deals with the topic of diet, healthy eating and, for our example: seasonal fruit in comparison. We want to show the 3 most popular types of fruit that currently come from the region (a good trend topic for autumn, winter and the beginning of spring). Additionally, the infographics contain interesting information about vitamins and minerals. This way the user gets all aspects that make a good infographics: Data, design, story and share.
Tip! If you want to learn more about the systematics of infographics, take a look at the Youtube video! Here you will find the 4 factors of good infographics and more videos for your Photoshop skills.
Explanatory video: Create infographics with photos (German)
Download: Template for infographics (English)
You can download the graphic shown in the video here for free! So you can see how it is constructed, but you can also become active yourself.
- Download: Template infographic – example fruit (zip-archive)
More videos: Infographics with Photoshop
In the 2nd and 3rd example we come to special and quickly created text infographics as well as a special: self painted infographics. Both examples and videos can be found further down in the article!
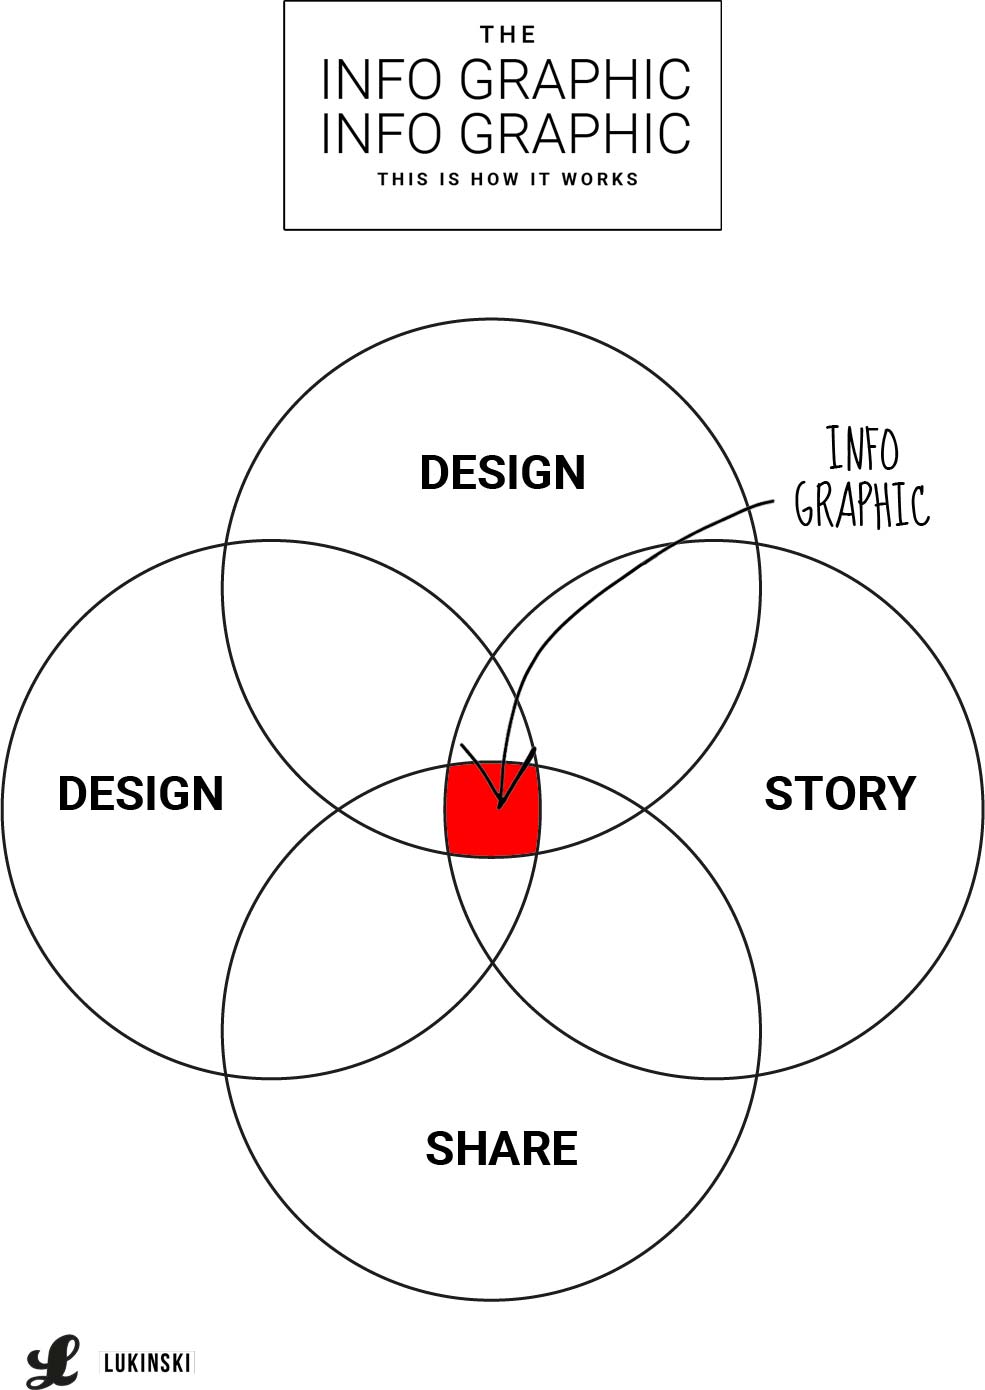
How is a good infographics created?
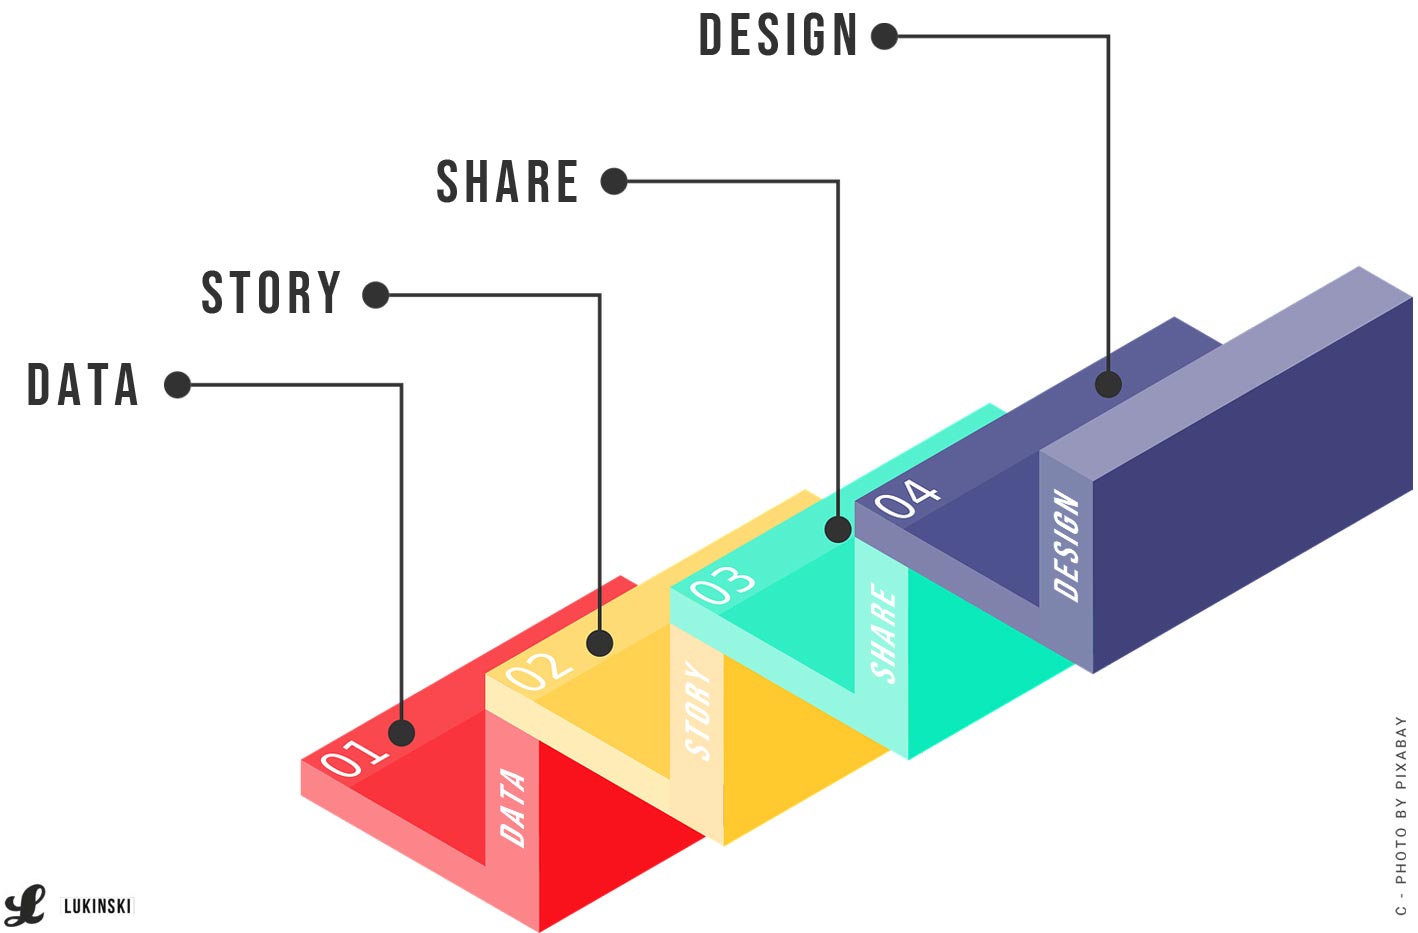
Every good infographics for blogs and social media contains four factors:
- Data the data basis
- Design the design of the graphics
- Story the content compilation
- Share preparation for social networks
Data: Data basis for interesting facts
The first important factor is your data basis. Without the necessary information no infographics can be made. For example, if you don’t know who will win the next US presidential election, you won’t be able to make an infographics of the winners. Accordingly, an existing data base is always the foundation.
Story: Content compilation and the teaser
Which data do you have and which pictures, if you want to use any? If you have a good data basis for your infographics, for example an evaluation, a study, an assessment as well as the necessary graphics, you should want to use pictures, e.g. as mentioned above in the field of pet food the “Top Five of Pets”, by using dog, cat, budgie and co.
Data is not everything, of course there should be a good story behind it. One of the easiest ways to do this is by ranking in toplists. Like:
- “Top 10 household appliances”
- “Top 6 of the most expensive Ferraris“
- Top 5 Most Popular Pets
Design: Design of the graphics
The story also always corresponds with the design of your infographics – how do you present the “story”?
For example, if you take up a relatively simple topic, as well as the mentioned top list, then the graphic design is relatively simple. However, if you are dealing with a complex topic and also a more complex target group, e.g. as in this example Social Media and Online Marketing Manager, then a graphic can be more extensive. But it is important that it summarizes many aspects and provides a quick and clear picture.
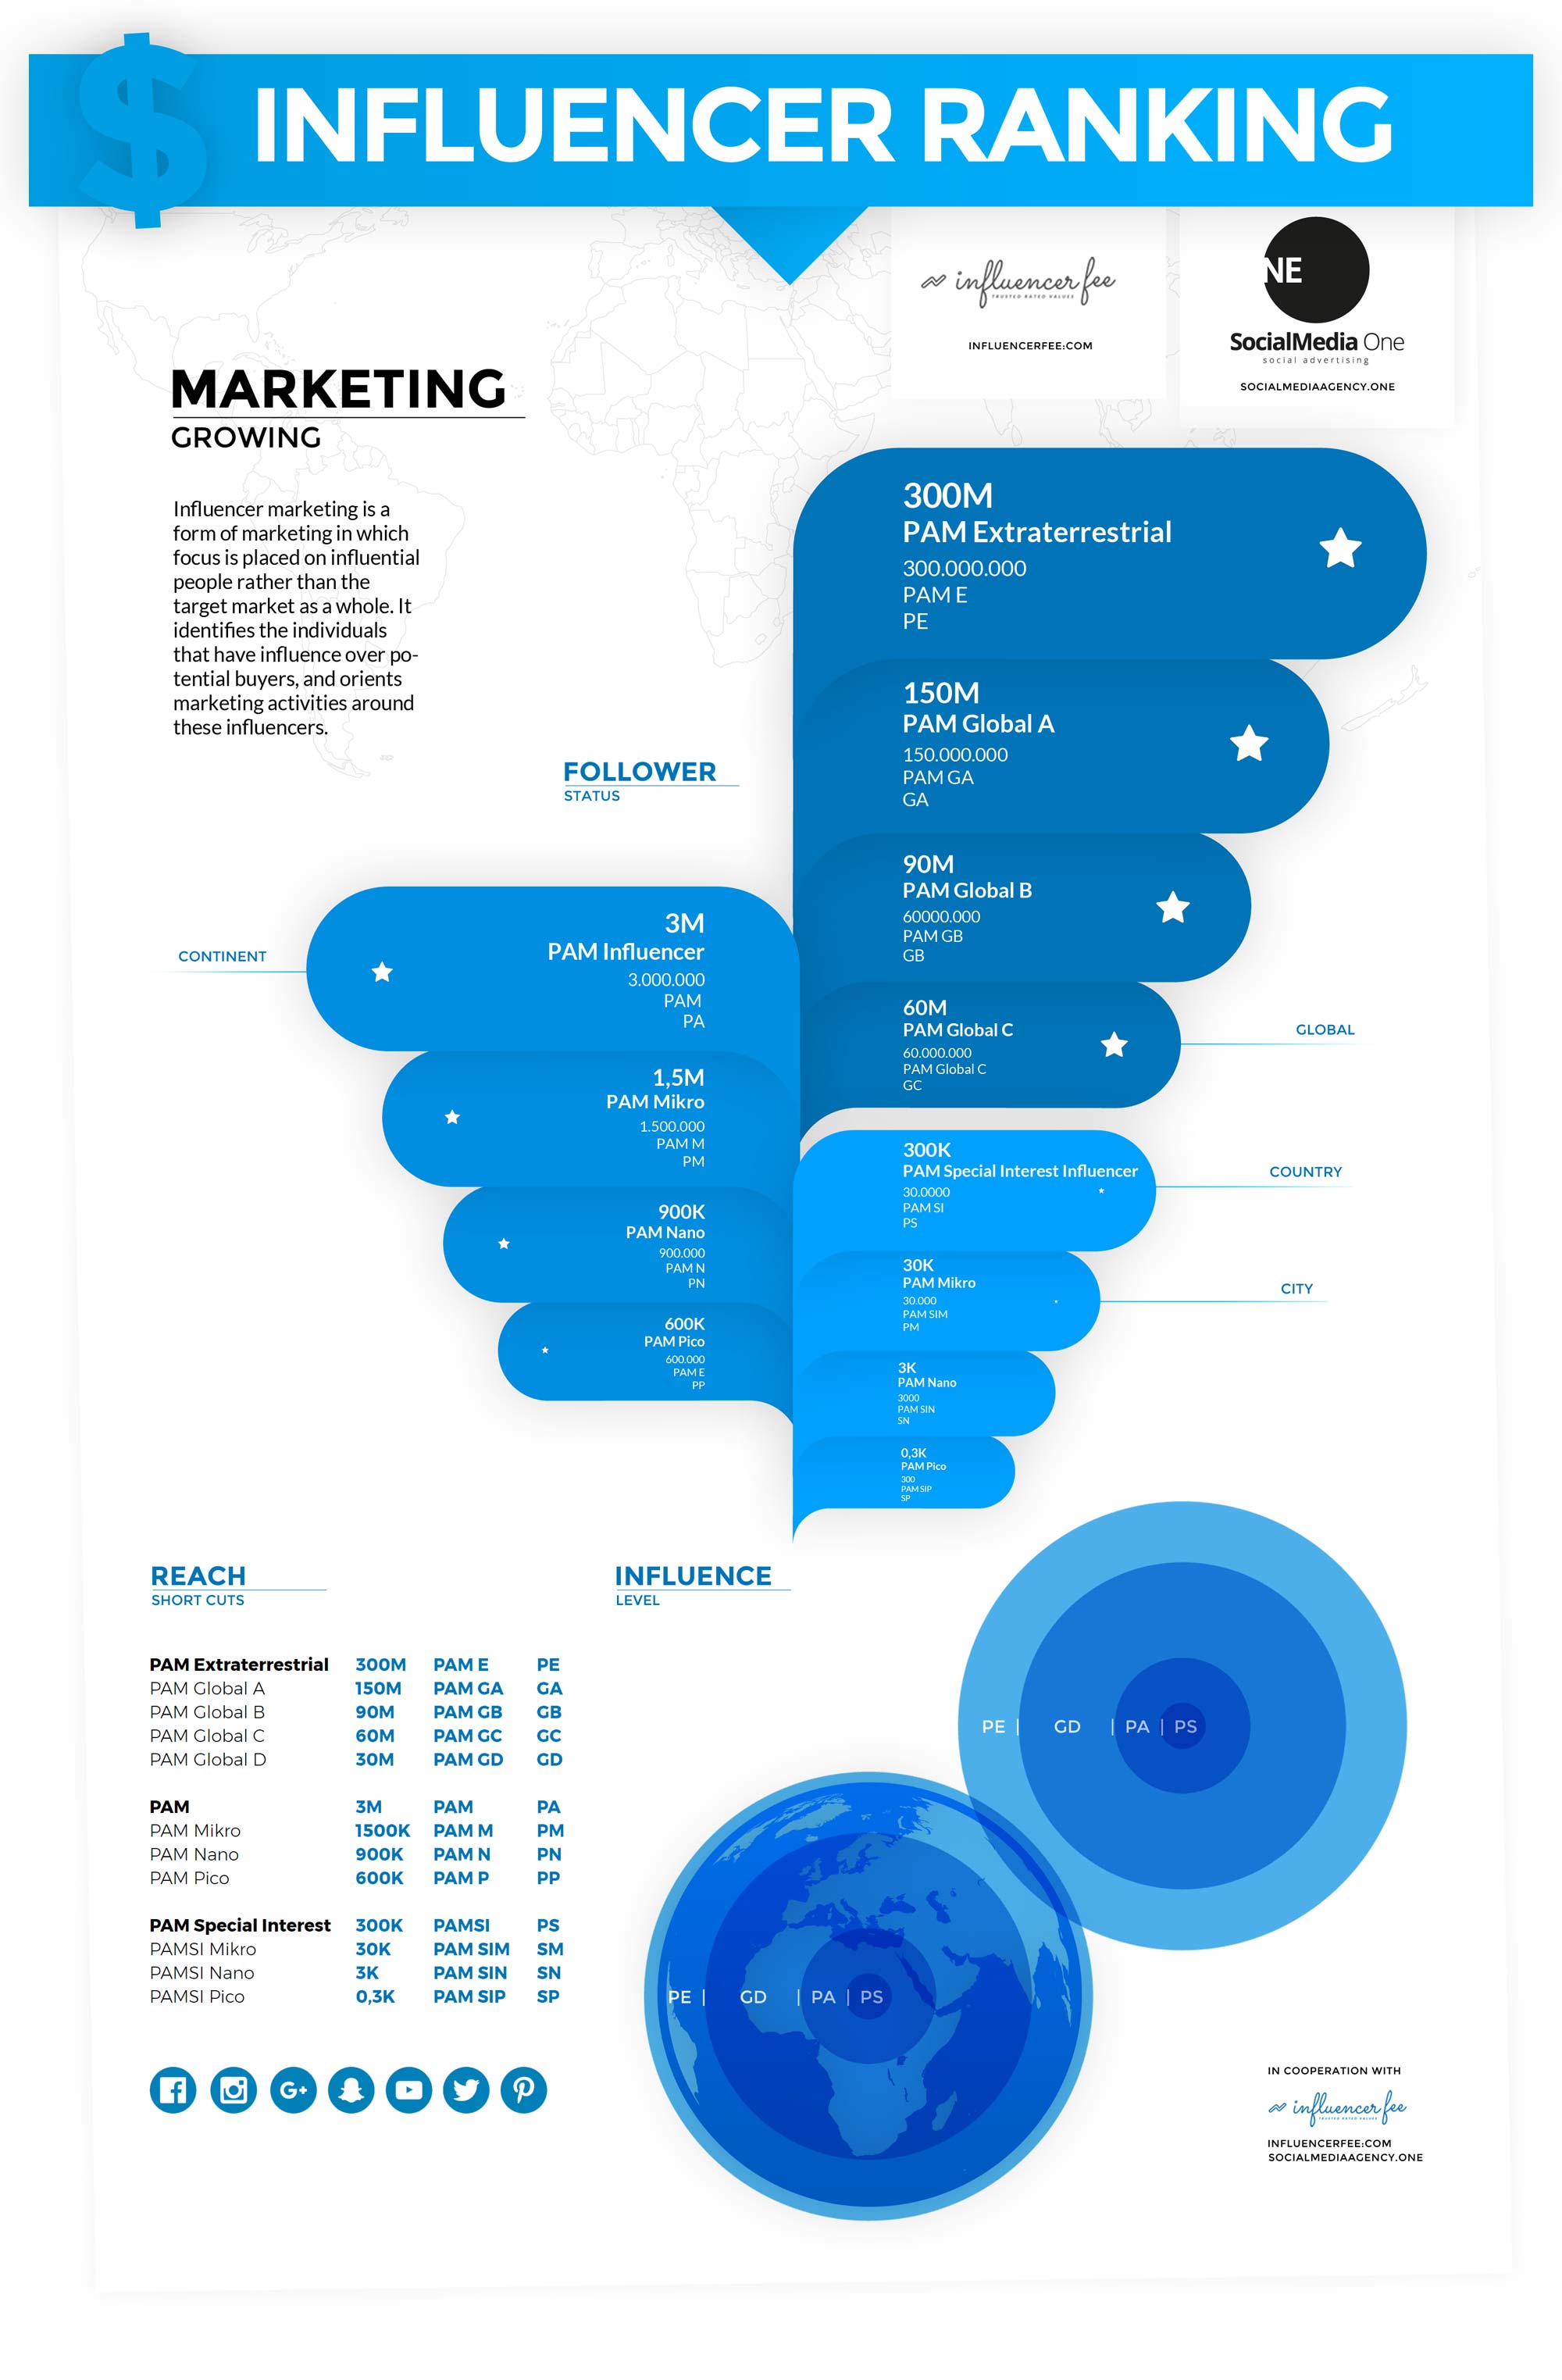
Example 1: Detailed information graphic
It is aimed at social media managers in companies. There are deliberate details for which you have to zoom (keyword interaction). The graphic contains new knowledge and thus has a high share factor.
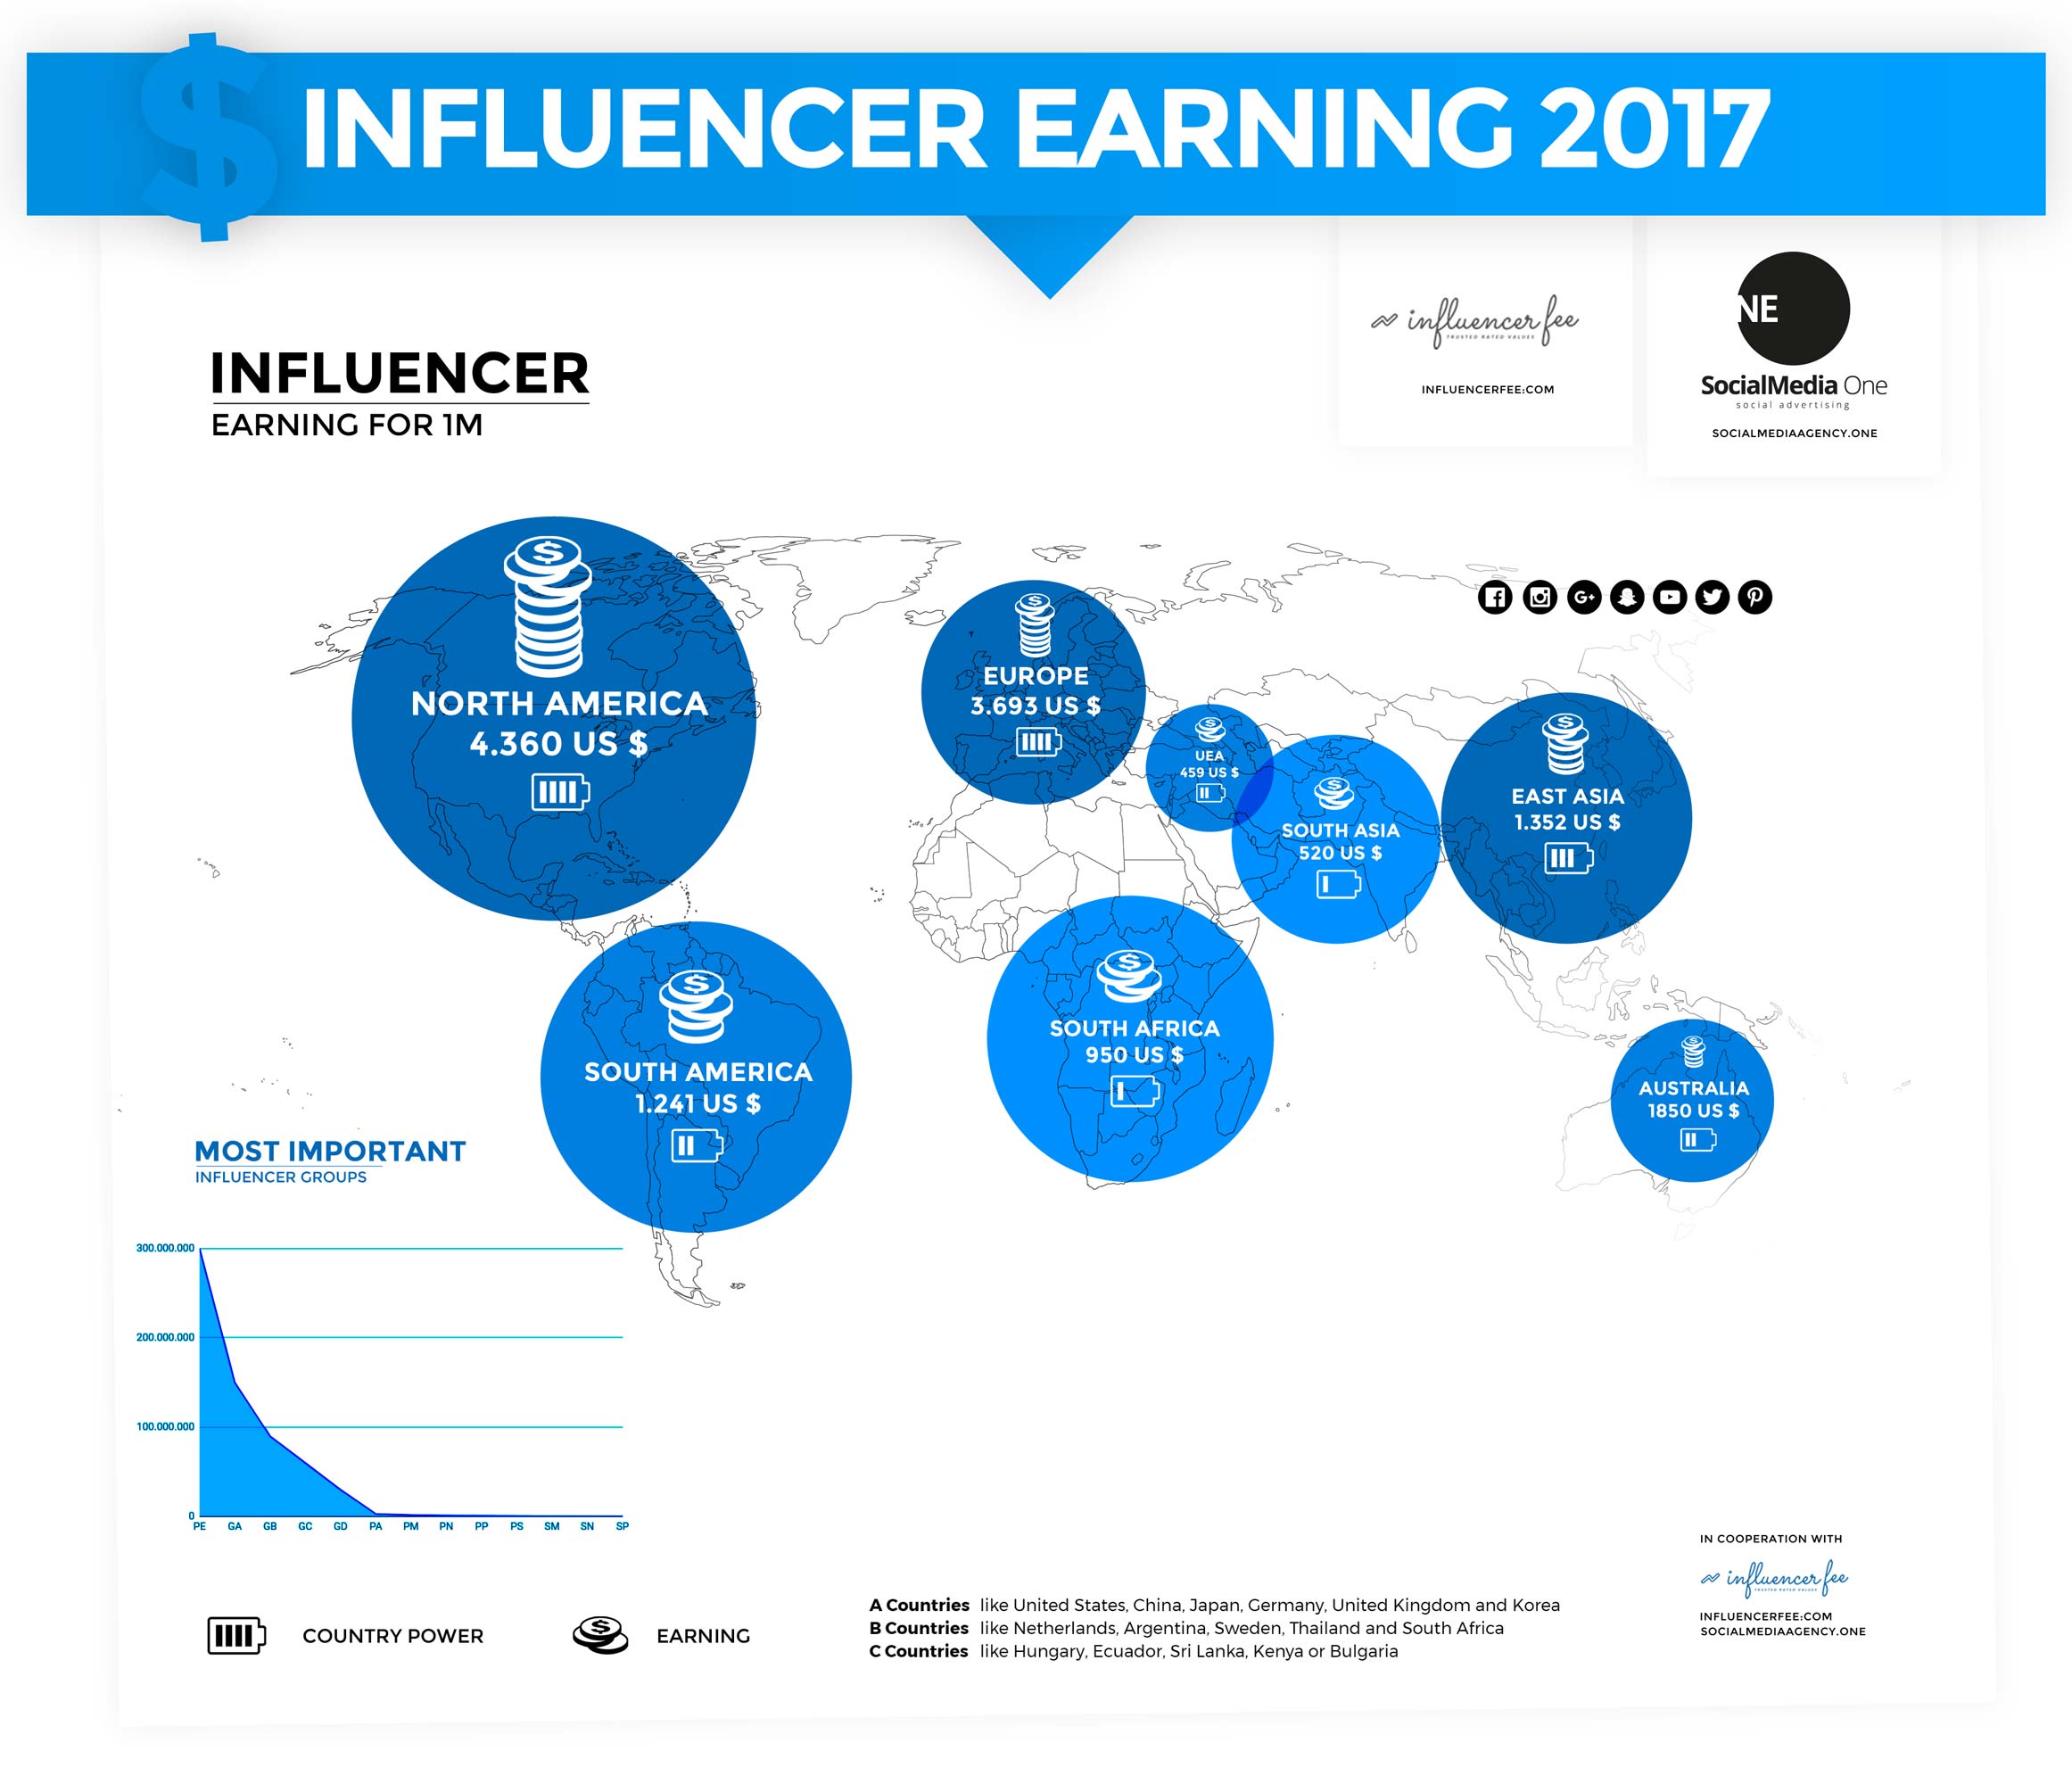
Example 2: Viral infographics
How do you achieve relatively high virality? Think about tabloid themes: who hangs out with whom? Who makes the most money? Which fashion designers are in demand on the red carpet? in the example you can see how much an influencer earns. the graphic is from 2017 – oldie, but goldie!
Create infographics (2): Toplist with texts (German)
In the second example you will now learn how to quickly create infographics with text. As shown in this example, you can quickly and easily display the most popular first names of the current year of birth in an infographic.
This way you can create two lists in no time at all, for female and male first names. If you want to go even deeper into the search engine optimization, e.g. if you have an online shop for prams or baby food, you could have this infographic prepared by an employee for the individual years or even decades (70s, 80s, 90s, etc). This way you would have great and individual content, which would be appreciated by your visitors but also by the algorithm of the search engines.
How to create infographics with text in no time at all you will learn here in Photoshop.
Explanatory video: Create infographics with lists (German)
[ THE VIDEO WILL BE RELEASED IN A FEW DAYS ]
Download: Template for infographics (English)
You can download the graphic shown in the video here for free! So you can see how it is constructed, but you can also become active yourself.
- Download: Template infographics – Example names (zip-archive)
Create infographics (3): Graphics in video: Painted and transparent
In the third example from my “Infographics Special” on Youtube you learn how to import self-drawn sketches into Photoshop and save them afterwards. Practically you will also learn how to save these graphics transparently and how to use them in your own videos. This way you can increase the authenticity of your YouTube videos by using self-drawn graphics. Maybe you will soon have your own info product with individual graphics? Now you know how it works!
Explanatory video: Create infographics in-video (German)
[ THE VIDEO WILL BE RELEASED IN A FEW DAYS ]
Sharing: Viral factors for social networks
From design, story and the data available to you is the transition to sharing in social networks flow. The better your data is prepared, the better the little story is told, the clearer and quicker your graphics are to understand, the higher is the probability that it will be shared by visitors of your website or even fans of your social media site.
These were my 3 example videos for you! Create infographics with Photoshop, from design to SEO and viral posts. If you liked my free explanatory videos, follow my Photoshop playlist (German) or me on Youtube: Lukinski!

Backlinks for beginners: building links (link building) for reach

Maximum visibility on the web: Why choosing the right SEO agency is crucial
SEO strategy with mini tools: The secret weapon for page 1 content - B2B leads example
Google Traffic Millionaire! SEO strategy longtail: focus keywords and keyword chains
SEO example 472 % performance: increase (rating) in 12 months - best practice e-commerce
Thumbnail explained: thumbnail for photos and videos + optimization tips


 4.9 / 5.0